Statistics For Data Science & Business Analytics In Python
Published 10/2023
MP4 | Video: h264, 1280x720 | Audio: AAC, 44.1 KHz
Language: English | Size: 2.92 GB | Duration: 10h 39m
Apply Statistics in Real World Business Problems Using Python. Build a Career in Data Science and Business Analytics.
What you'll learn
Foundational understanding of python to analyze data using NumPy and Pandas, and use statistical packages such as SciPy and statsmodels.
Analyzing and visualizing data using python using line charts, bar charts, pie charts, histogram and box plots.
Conducting univariate and bivariate analysis using one-way tables, two-way tables.
Descriptive statistics for univariate and bivariate analysis - mean, median, mode, range, IQR, variance, standard deviation, covariance and correlation.
Data distributions, including mean, variance, and standard deviation, T-distribution and normal distributions and z-scores.
Probability, including union vs. intersection and independent and dependent events and Bayes' theorem.
Sampling distribution, central limit theorem and intuition behind using central limit theorem in hypothesis testing.
Hypothesis testing, including inferential statistics, significance level, type I and II errors, test statistics, and p-values. Test of proportions and chi-squar
Simple Linear Regression using manual method as well as using OLS package in python, Multiple Linear regression, and predicting using the regression model.
Requirements
No programming experience required. You will learn the python foundations in this course.
You will need a computer with internet access to install Jupyter notebook and run python codes.
You will need to have basic math and arithmetic skills to be able to understand statistics and probability.
Description
Welcome to our comprehensive course on Statistics for Data Science & Business Analytics using Python! If you're looking to gain a deep understanding of Statistics for Data Science & Business Analytics and develop the skills necessary to excel in this field, you've come to the right place. With over 10 hours of engaging video content, 75+ informative lectures and 16 thought-provoking quizzes, this course is designed to take you on a transformative learning journey. Whether you're a novice looking to build a solid foundation or an experienced professional aiming to refine your expertise, this course promises to equip you with the knowledge and tools you need to succeed.In today's fast-paced world, staying competitive and relevant in your chosen field is more crucial than ever. This course aims to empower you with a comprehensive understanding of Statistics for Data Science & Business Analytics, covering a wide range of topics and concepts to ensure you're well-prepared for any challenges that come your way. From the fundamentals to advanced techniques, we've carefully curated the content to provide you with a holistic learning experience.About the Instructor:This course will be taught by Farzan Sajahan, who has an executive MBA from Rotterdam School of management with over 18 years of experience in data analytics and management consulting. He has worked extensively in data analytics and operations management. He has been teaching data science for the last 4 years to over 60,000 students. He is running a management consulting firm based out of India.What to Expect from This Course:1. In-Depth Video Content: Our course boasts more than 10 hours of meticulously crafted video lessons. These videos are designed to make complex topics accessible and engaging. You'll have the opportunity to learn from expert in the field who will guide you through each concept, ensuring that you not only understand the theory but also its practical applications.2. Interactive Quizzes: Learning is most effective when it's interactive. To reinforce your understanding, we've included 80 quiz questions throughout the course. These quizzes are strategically placed to test your knowledge and help you gauge your progress. Don't worry; they're not just for assessment purposes-they're also fun!3. Comprehensive Lecture Series: The 75+ lectures included in this course provide a deep dive into the subject matter. You'll explore the intricacies of Statistics for Data Science & Business Analytics, gaining insights and practical tips that are valuable for both beginners and experienced professionals. Our lecturers are passionate about the topic, and their enthusiasm will inspire and motivate you.4. Real-World Applications: We understand that theory alone is not enough. That's why we emphasize real-world applications throughout the course. You'll learn how to put your newfound knowledge into practice, enabling you to excel in your current job or prepare for future opportunities.5. Access to Resources: As a student in this course, you'll have access to a wealth of resources, including python notebooks and datasets. These resources are designed to enhance your learning experience and provide you with valuable references for future use.6. Lifetime Access: Once you enroll in this course, you'll have lifetime access to all the materials. You can revisit the content whenever you need a refresher or want to explore more advanced topics. Your learning journey doesn't have an expiration date.This course on Statistics for Data Science & Business Analytics using Python is your gateway to becoming a proficient and confident Statistics practitioner. Whether you're seeking personal growth, career advancement, or simply looking to satisfy your curiosity, we're here to guide you every step of the way. So, let's embark on this exciting journey together, unlock your potential, and discover the limitless possibilities that await you in the world of Statistics for Data Science & Business Analytics. Enroll today and let's get started!
Overview
Section 1: Getting started
Lecture 1 Let's get started: Download code and Datasets
Lecture 2 Quick note!
Section 2: Python basics
Lecture 3 Installing anaconda distribution and Jupyter
Lecture 4 Tour of Jupyter notebook
Lecture 5 Calculations in Python
Lecture 6 Variables in python
Lecture 7 Collection data types in python - List
Lecture 8 Collection data types in python continued - Tuples, Sets and Dictionaries
Section 3: Core programming in Python
Lecture 9 Conditional and logical statements
Lecture 10 For and While loops
Lecture 11 Functions
Section 4: Arrays, Matrices and data frames
Lecture 12 Numpy arrays
Lecture 13 ndarrays in numpy
Lecture 14 Access values from a matrix
Lecture 15 Pandas Series
Lecture 16 Pandas Data Frames
Lecture 17 Data frame manipulation
Section 5: Introduction to Statistical Data Analysis
Lecture 18 Introduction to Statistical Data Analysis
Lecture 19 Variables in Statistical Data Analysis
Lecture 20 Population Vs Samples
Section 6: Data visualization in python
Lecture 21 One way tables
Lecture 22 Line Charts and Bar charts
Lecture 23 Pie Charts
Lecture 24 Two way cross tables
Lecture 25 Heat maps
Section 7: Univariate data analysis
Lecture 26 Central tendency measures: mean, median, mode
Lecture 27 Dispersion measures: range and interquartile range
Lecture 28 Histogram
Lecture 29 Box plot
Lecture 30 Outliers
Lecture 31 Variance and Standard deviation
Lecture 32 Univariate hands-on exercise
Section 8: Bivariate data analysis
Lecture 33 Introduction to Bivariate analysis
Lecture 34 Covariance and Correlation
Lecture 35 Bivariate hands-on exercise
Section 9: Probability
Lecture 36 Probability theory
Lecture 37 Estimating simple probabilities - single independent event
Lecture 38 Estimating probability in case of two or more events
Lecture 39 Conditional Probability
Lecture 40 Review the Multiplication law of probability
Lecture 41 Bayes theorem
Section 10: Random Distributions
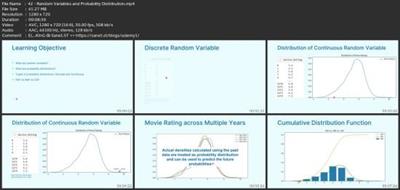
Lecture 42 Random Variables and Probability Distribution
Lecture 43 Using Probability Distribution to Estimate Probabilities
Lecture 44 Normal distribution
Lecture 45 Normal Distribution Hands-on
Lecture 46 T-distribution
Lecture 47 Finding actual values from the probability
Lecture 48 Sampling Distribution
Lecture 49 Central limit theorem hands-on
Section 11: Hypothesis Testing - Test of Means
Lecture 50 Introduction to Inferential statistics and hypothesis testing
Lecture 51 Introduction to test of means
Lecture 52 Steps for conducting test of means
Lecture 53 One sample, right tail test
Lecture 54 One sample, left tail test
Lecture 55 One sample, two tail T test
Lecture 56 Two sample, unpaired T test
Lecture 57 Two sample, paired T test
Lecture 58 Errors in hypothesis testing
Section 12: Analysis of Variance (ANOVA)
Lecture 59 ANOVA Introduction
Lecture 60 ANOVA Intuition
Lecture 61 One Way ANOVA manual computation
Lecture 62 One Way ANOVA using python
Lecture 63 Two Way ANOVA - case 1 (Diet Plan)
Lecture 64 Two Way ANOVA - case 2 (Movies analysis)
Section 13: Test of proportions
Lecture 65 Introduction to test of proportions and independence using Chi-square test
Lecture 66 Chi square test hands-on
Section 14: Simple Linear Regression
Lecture 67 Introduction to Linear Regression
Lecture 68 Goodness of fit
Lecture 69 Condition for linear regression
Lecture 70 Simple Linear Regression - Manual method
Lecture 71 Simple Linear Regression - Using OLS package
Section 15: Multiple Linear Regression
Lecture 72 MLR - case
Lecture 73 Creating our first MLR model
Lecture 74 Improving the MLR model
Lecture 75 Another way to build the MLR model
Section 16: Conclusion
Lecture 76 Conclusion
Anyone who wants to build a career in data science but lacks the foundational skills in statistics,Data analysts who are familiar with analyzing data but want to learn concepts in statistics to be able to do rigorous analysis,Masters and research students who would like to learn statistics,Data analysts who are familiar with data analysis in excel but want to learn statistics using python,Data visualization experts who would like to explore statistics using python
Screenshots

Download link
rapidgator.net:
https://rapidgator.net/file/6aa3c5eb148a7c8764138e8cf0a10ad1/kiysl.Statistics.For.Data.Science..Business.Analytics.In.Python.part1.rar.html
https://rapidgator.net/file/702e9e231f84c076944b46a211fcfcd3/kiysl.Statistics.For.Data.Science..Business.Analytics.In.Python.part2.rar.html
https://rapidgator.net/file/1eea7b7879c1e7605dc423d1d51e3bb3/kiysl.Statistics.For.Data.Science..Business.Analytics.In.Python.part3.rar.html
https://rapidgator.net/file/a882419a0092a02e7d93d0572a79d5ce/kiysl.Statistics.For.Data.Science..Business.Analytics.In.Python.part4.rar.html
uploadgig.com:
https://uploadgig.com/file/download/6D1cb1b3F20077ab/kiysl.Statistics.For.Data.Science..Business.Analytics.In.Python.part1.rar
https://uploadgig.com/file/download/f6dC227c7A22558d/kiysl.Statistics.For.Data.Science..Business.Analytics.In.Python.part2.rar
https://uploadgig.com/file/download/ea4205d8abb65E29/kiysl.Statistics.For.Data.Science..Business.Analytics.In.Python.part3.rar
https://uploadgig.com/file/download/b83c0E47dd3000ed/kiysl.Statistics.For.Data.Science..Business.Analytics.In.Python.part4.rar
nitroflare.com:
https://nitroflare.com/view/B9B654351E28C07/kiysl.Statistics.For.Data.Science..Business.Analytics.In.Python.part1.rar
https://nitroflare.com/view/38ABD384FCE8CCE/kiysl.Statistics.For.Data.Science..Business.Analytics.In.Python.part2.rar
https://nitroflare.com/view/1454B0D55F3CE5E/kiysl.Statistics.For.Data.Science..Business.Analytics.In.Python.part3.rar
https://nitroflare.com/view/D6AB490A9A7E471/kiysl.Statistics.For.Data.Science..Business.Analytics.In.Python.part4.rar