Introduction To Research Data Analysis: Excel Application
Published 10/2023
MP4 | Video: h264, 1920x1080 | Audio: AAC, 44.1 KHz
Language: English | Size: 887.56 MB | Duration: 1h 30m
Beginner's Guide for Application Using Microsoft Excel
What you'll learn
Identify and discuss the various statistical methods
Choose the right statistics for analysis collected data
Implement data analysis on Microsoft Excel
Interpret results of analsys and draw inferences
Requirements
No programming skills or knowledge of statistics required
Description
While Excel is a powerful tool for data analysis, it's worth noting that for more complex and specialized tasks, you may eventually need to explore other data analysis tools and programming languages. However, Excel is an excellent starting point and can often meet the needs of many data analysis projects. It is for this reason that this course presents the fundamentals in data analysis, and a guide on how to use of Microsoft Excel for this purpose. It offers lessons that covers areas in Measures of Central Tendency, Measures of Dispersion, Correlation, Regression and Inferential statistics.Excel is known for its user-friendly interface. It doesn't require extensive programming or technical skills, making it accessible to a broad audience. It provides a wide range of built-in functions and formulas for performing basic calculations and mathematical operations.Excel is a versatile tool that can handle a wide range of data analysis tasks, from simple data entry and calculations to more complex statistical analysis and data visualization. Learning Excel for data analysis provides you with transferable skills that can be valuable in various roles and industries. It can also serve as a foundation for learning more advanced data analysis tools like Microsoft Power BI, R, or Python.
Overview
Section 1: Introduction
Lecture 1 Introduction
Section 2: Measures of Central Tendency
Lecture 2 MEASURES OF CENTRAL TENDENCY I
Lecture 3 MEASURES OF CENTRAL TENDENCY II: USING EXCEL
Section 3: Measures of Dispersion
Lecture 4 MESAURES OF DISPERSION I
Lecture 5 MEASURE OF DISPERSION II: USING EXCEL
Section 4: Correlation and Regression
Lecture 6 CORRELATION AND REGRESSION I
Lecture 7 CORRELATION AND REGRESSION II: USING EXCEL
Section 5: Hypothesis Testing and Inferential Statistics
Lecture 8 HYPOTHESIS TESTING AND INFERENTIAL STATISTICS I
Lecture 9 HYPOTHESIS TESTING AND INFERENTIAL STATISTICS II: USING EXCEL
Academic researchers,High school, undergraduate and postgraduate students
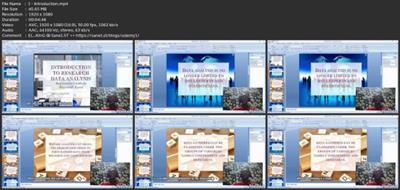
Screenshots

Download link
rapidgator.net:
https://rapidgator.net/file/f9a47a3fd24c284298e4c2930480cc21/uhabl.Introduction.To.Research.Data.Analysis.Excel.Application.rar.html
uploadgig.com:
https://uploadgig.com/file/download/f9180764523fC7Bd/uhabl.Introduction.To.Research.Data.Analysis.Excel.Application.rar
nitroflare.com:
https://nitroflare.com/view/DC7AB882B575153/uhabl.Introduction.To.Research.Data.Analysis.Excel.Application.rar